
Could the entire ACCU scheme offset all Qantas Group emissions
Putting ACCU scale into perspective
We talk about the ACCU scheme a lot in abstract terms. Millions of tonnes here, safeguard targets there. It is hard to get a feel for what any of it actually means in the real world.

So it helps to tie the numbers to something everyone knows. Aviation is an obvious choice. Putting it against a highly respected brand in a familiar industry allows some perspective: Qantas is a household name, and its emissions footprint is well documented. That brings us to the question that kicked this off.
Could the entire ACCU scheme offset all Qantas Group emissions?
Here is the original comparison that started the conversation:
Qantas emissions for FY25 were 19.5m tonnes CO₂-e (all scopes, global).
ACCU’s issued in FY25 were 20.6m
(that represents 20.6m tonnes CO₂-e of credited abatement).
A reminder that the ACCU scheme is still in an early growth phase, and that the worry it gives emitters a free pass isn’t supported by the numbers, the scheme just isn't big enough for that yet. That is the heart of it. Let’s look at why this simple comparison works and what it tells us about the market.
The scale problem no one talks about
People often treat ACCUs as if there is an unlimited supply waiting to be tapped. In reality the scheme remains small compared with what Australia emits every year. It is even smaller when you compare it against the emissions of major companies with global footprints.
Qantas clocked 19.5 million tonnes across all scopes in FY25. The entire ACCU issuance for the same period was 20.6 million units. That is almost a like for like match but only by accident of timing, not because ACCUs are overflowing.
The extra context makes it clearer:
Current ACCU issuance represents +- 4.7% of one year of Australia’s emissions (440 million tonnes CO₂-e). This is only for scale comparison. Sources: CER 2024–25 Annual Report; DCCEEW NGGI March 2025 update. Right now, ACCUs cannot carry the full burden of Australian decarbonisation, but they are an important part of the solution.
ACCU issuance is not the same as retirement/cancellation. Annual issuance does not represent abatement in any particular year: but it is a useful proxy for market scale, which is currently modest.
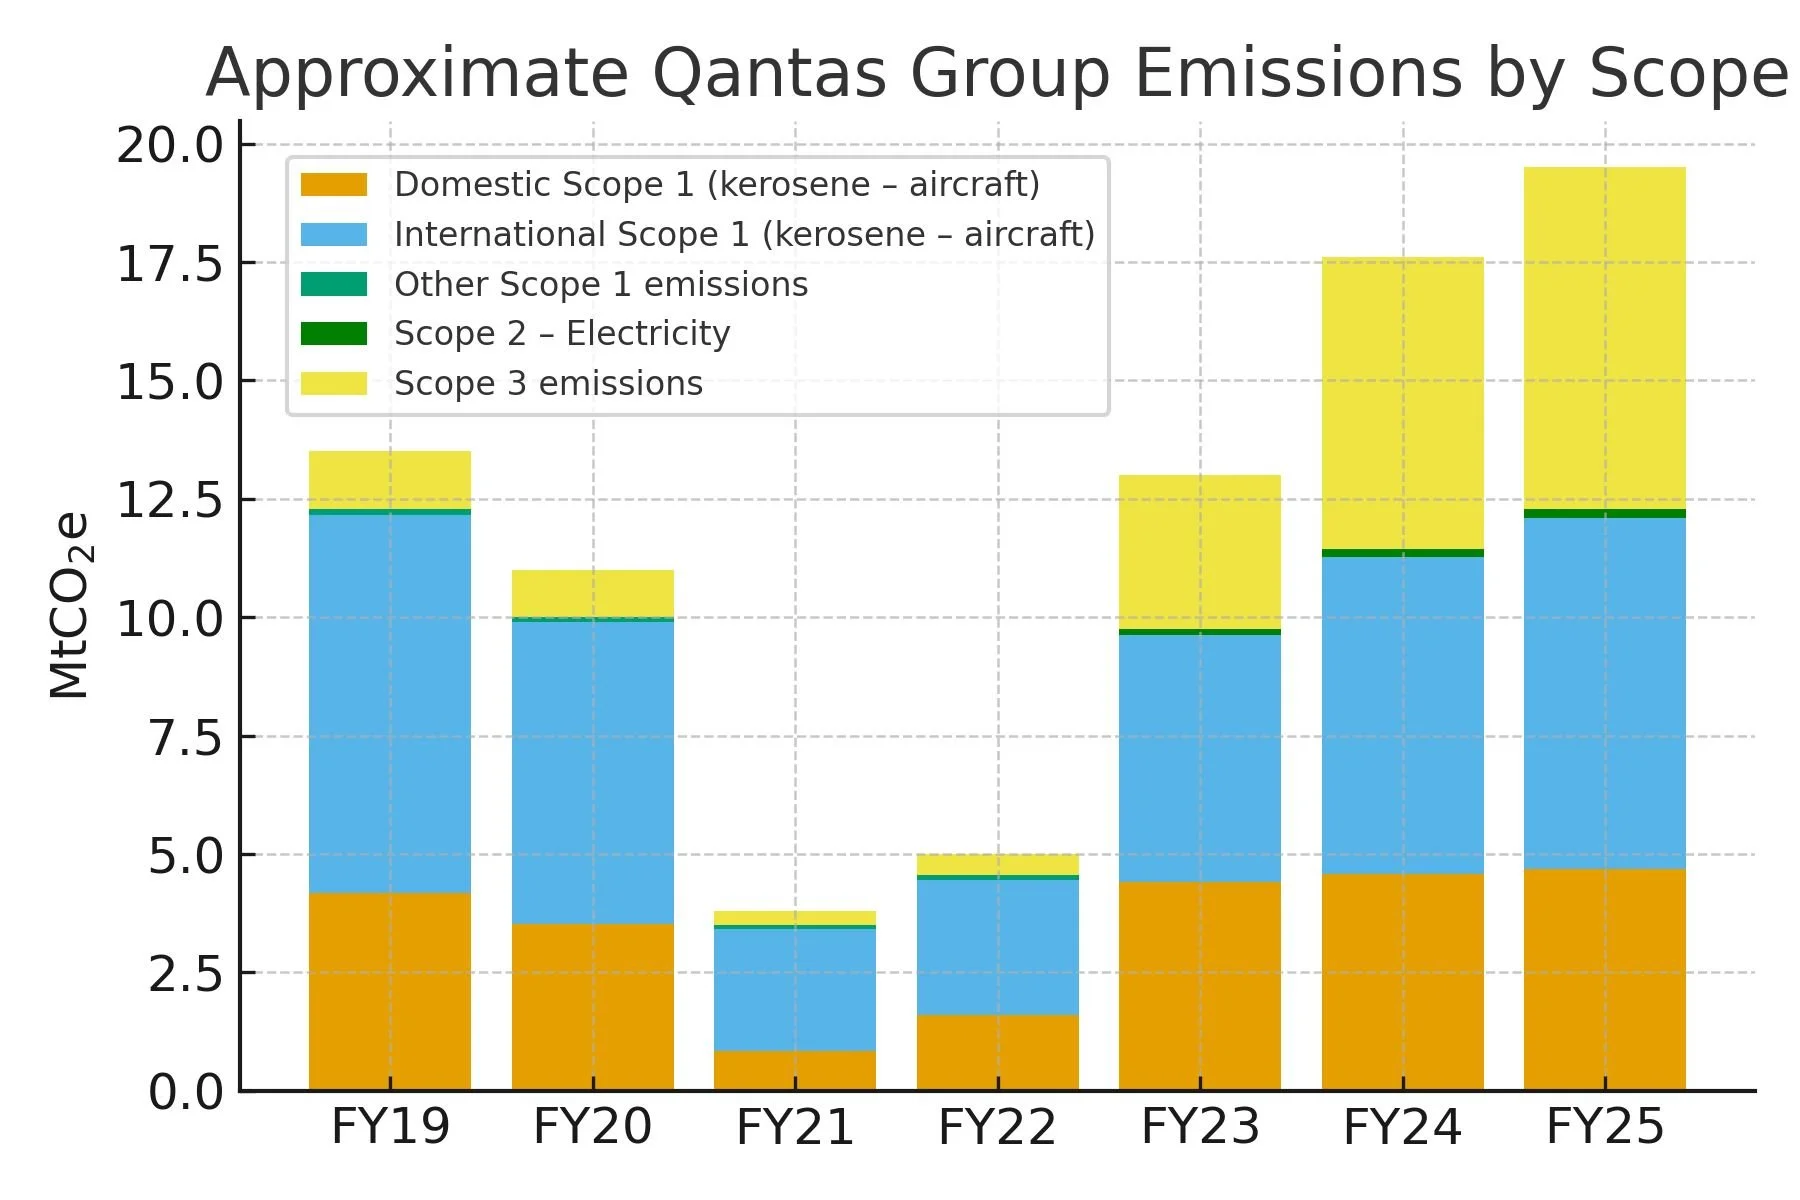
Qantas chart recreated from Qantas Group Sustainability Report FY25 (values approximate)
Check out our blog article talking about Qantas’ partnership with ALFA as an example of how carbon markets can support both climate and the community: Indigenous land and corporate offsets: What is Qantas buying into?
Why the Qantas comparison works
Aviation emissions are tangible. People fly and see planes every day. They have a feel for the size of the operation. So comparing the entire ACCU scheme to one airline group gives us an instant mental picture.
Qantas publishes clear scope 1, 2 and 3 numbers. Organisations with similar transparency are rare outside the ASX. Scope 3 emissions are everything in the value chain that sits outside a company’s direct control and is not covered by scope 1 or 2. The chart recreated from the Qantas Group Sustainability Report FY25 shows the bulk sits in scope 3, which is typical for aviation. It reminds us that even if Qantas wanted to buy offsets for the full footprint, the market is not yet enough to supply them without leaving too little for everyone else
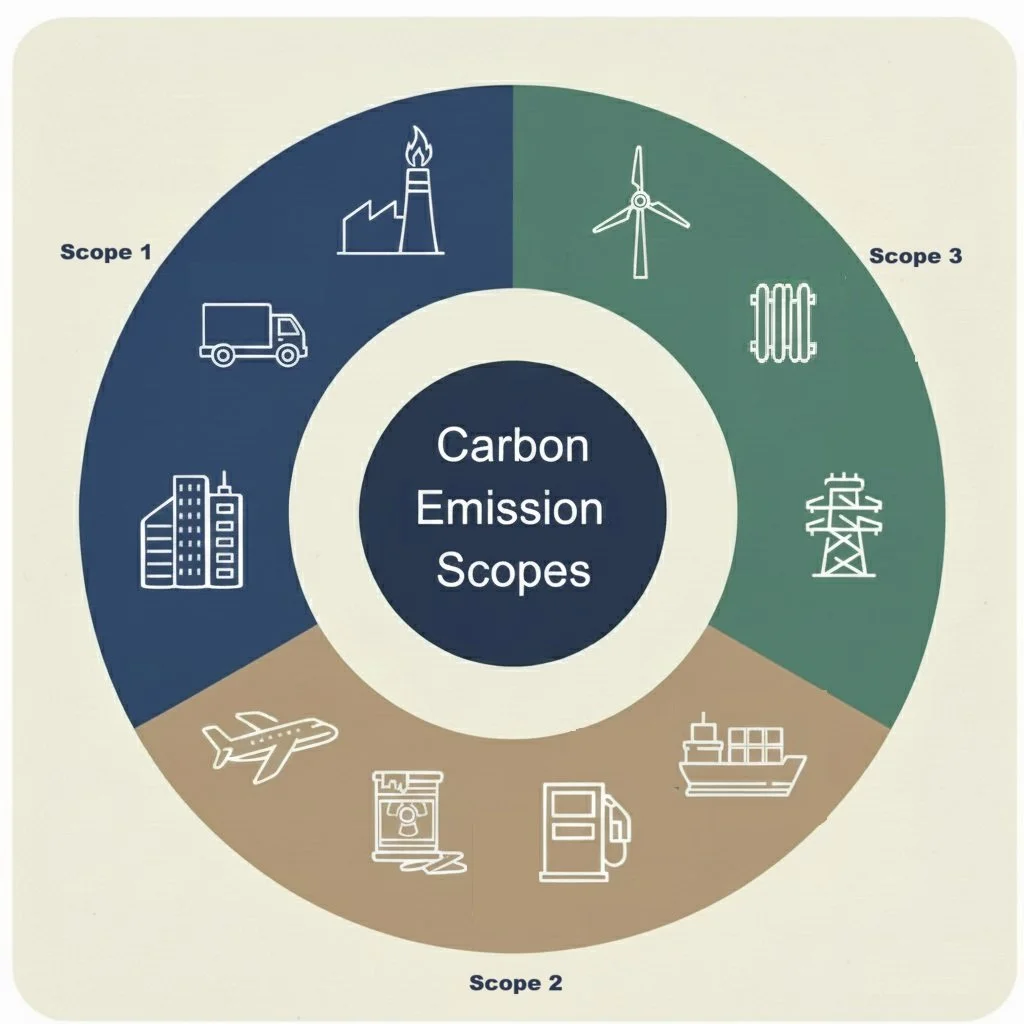
Scope 1: Direct emissions from fuel the company burns itself (e.g. jet fuel, company vehicles).
Scope 2: Indirect emissions from purchased energy (mainly electricity).
Scope 3: All other indirect emissions in the value chain (e.g. suppliers, customer use of products, staff travel).
These definitions matter because they show how much sits outside the direct control of the company. When critics say offsets let businesses avoid real action, they often ignore how limited scope 1 and 2 are in aviation. Some of the decarbonisation challenges for airlines are around technology, alternative fuels and supply chains that progressing but slowly.
What this tells us about the road ahead
The comparison is not about suggesting Qantas should or would offset everything. It simply shows the current scale of the ACCU market in a way that is easy to understand. Even matching one major emitter shows how early we still are in the scheme’s growth.
As the safeguard mechanism matures and sectors change, demand will rise and the market will need to grow with it. That is exactly how we would expect a developing market to work. More project methodologies releasing over time will increase supply.
The takeaway is that ACCUs have a clear role, but the idea that they somehow let big emitters avoid action doesn’t hold up when you look at the numbers. They are a tool to help reduce emissions, not the complete solution.
References
Clean Energy Regulator (CER):
Quarterly Carbon Market Reports, reports total ACCU issuance for the period plus historical issuance tables.
DCCEEW (Department of Climate Change, Energy, the Environment and Water):
National Greenhouse Gas Inventory Quarterly Update (March 2025) showing ~440 Mt CO₂-e national emissions.
Qantas Group Sustainability Report FY25 (Qantas emissions data):
Provides scope 1, 2 and 3 emissions values used to recreate the comparison chart. Values are approximate but based on this disclosure.
Want to know more?
Check out Rio Tinto and the rise of high integrity carbon credits in Australia, talking about why big emitters are demanding credits generated from high integrity methods.
Carbon Eyes | ACCU Market Intelligence
Strategic data and integrity signals for the Australian carbon market.
1. Carbon Data Platform
The Foundation of Market Transparency | Access the Platform
A comprehensive view of the ACCU landscape. Access structured CER data, project status and issuance trends. Use our core mapping and analytics to establish your market baseline.
2. Integrity & Market Intelligence
Independent Ratings & Supply Forecasts | Upgrade Your Intelligence
Mitigate risk with our paid intelligence layer. Accessed directly within the Platform, these add-ons provide independent ACCU project ratings and forward looking supply forecasts to guide procurement and investment.
3. Land & Asset Decisioning
Identify the Best Opportunities for Carbon Projects
Carbon Potential Report | View Carbon Potential Report (by address)
Instant, address-based viability assessments for lenders and investors.
Carbon Land Search | Identify & Assess High-Potential Assets
Our premium search engine for institutional funds. Identify and de-risk high-potential carbon assets before acquisition.