
How the ACCU project market is shaping up
Stepping back to see the full market picture
Looking beyond weekly noise reveals clearer trends in project pipelines, issuance and supply risk.
The Australian Carbon Credit Unit (ACCU) market is noisy up close. Every week there are announcements about new projects, changes to methodologies or debates about integrity. Sometimes the clearest insights come when you zoom out and look at the fuller picture. An aggregated view of the entire ACCU landscape shows not only what projects exist, but how the market is moving and where the real momentum lies.

A snapshot of the whole market
At a glance, you can see the total number of projects in the system. This includes how many have been newly registered and how many have been revoked, giving an instant sense of whether the market is expanding, stalling, or quietly contracting. Instead of scrolling through long lists or spreadsheets, you get a single snapshot that cuts through the detail.
“Gain an instant oversight and deeper understanding of the Australian carbon credit landscape. Try out our Analytics Dashboard for free.”
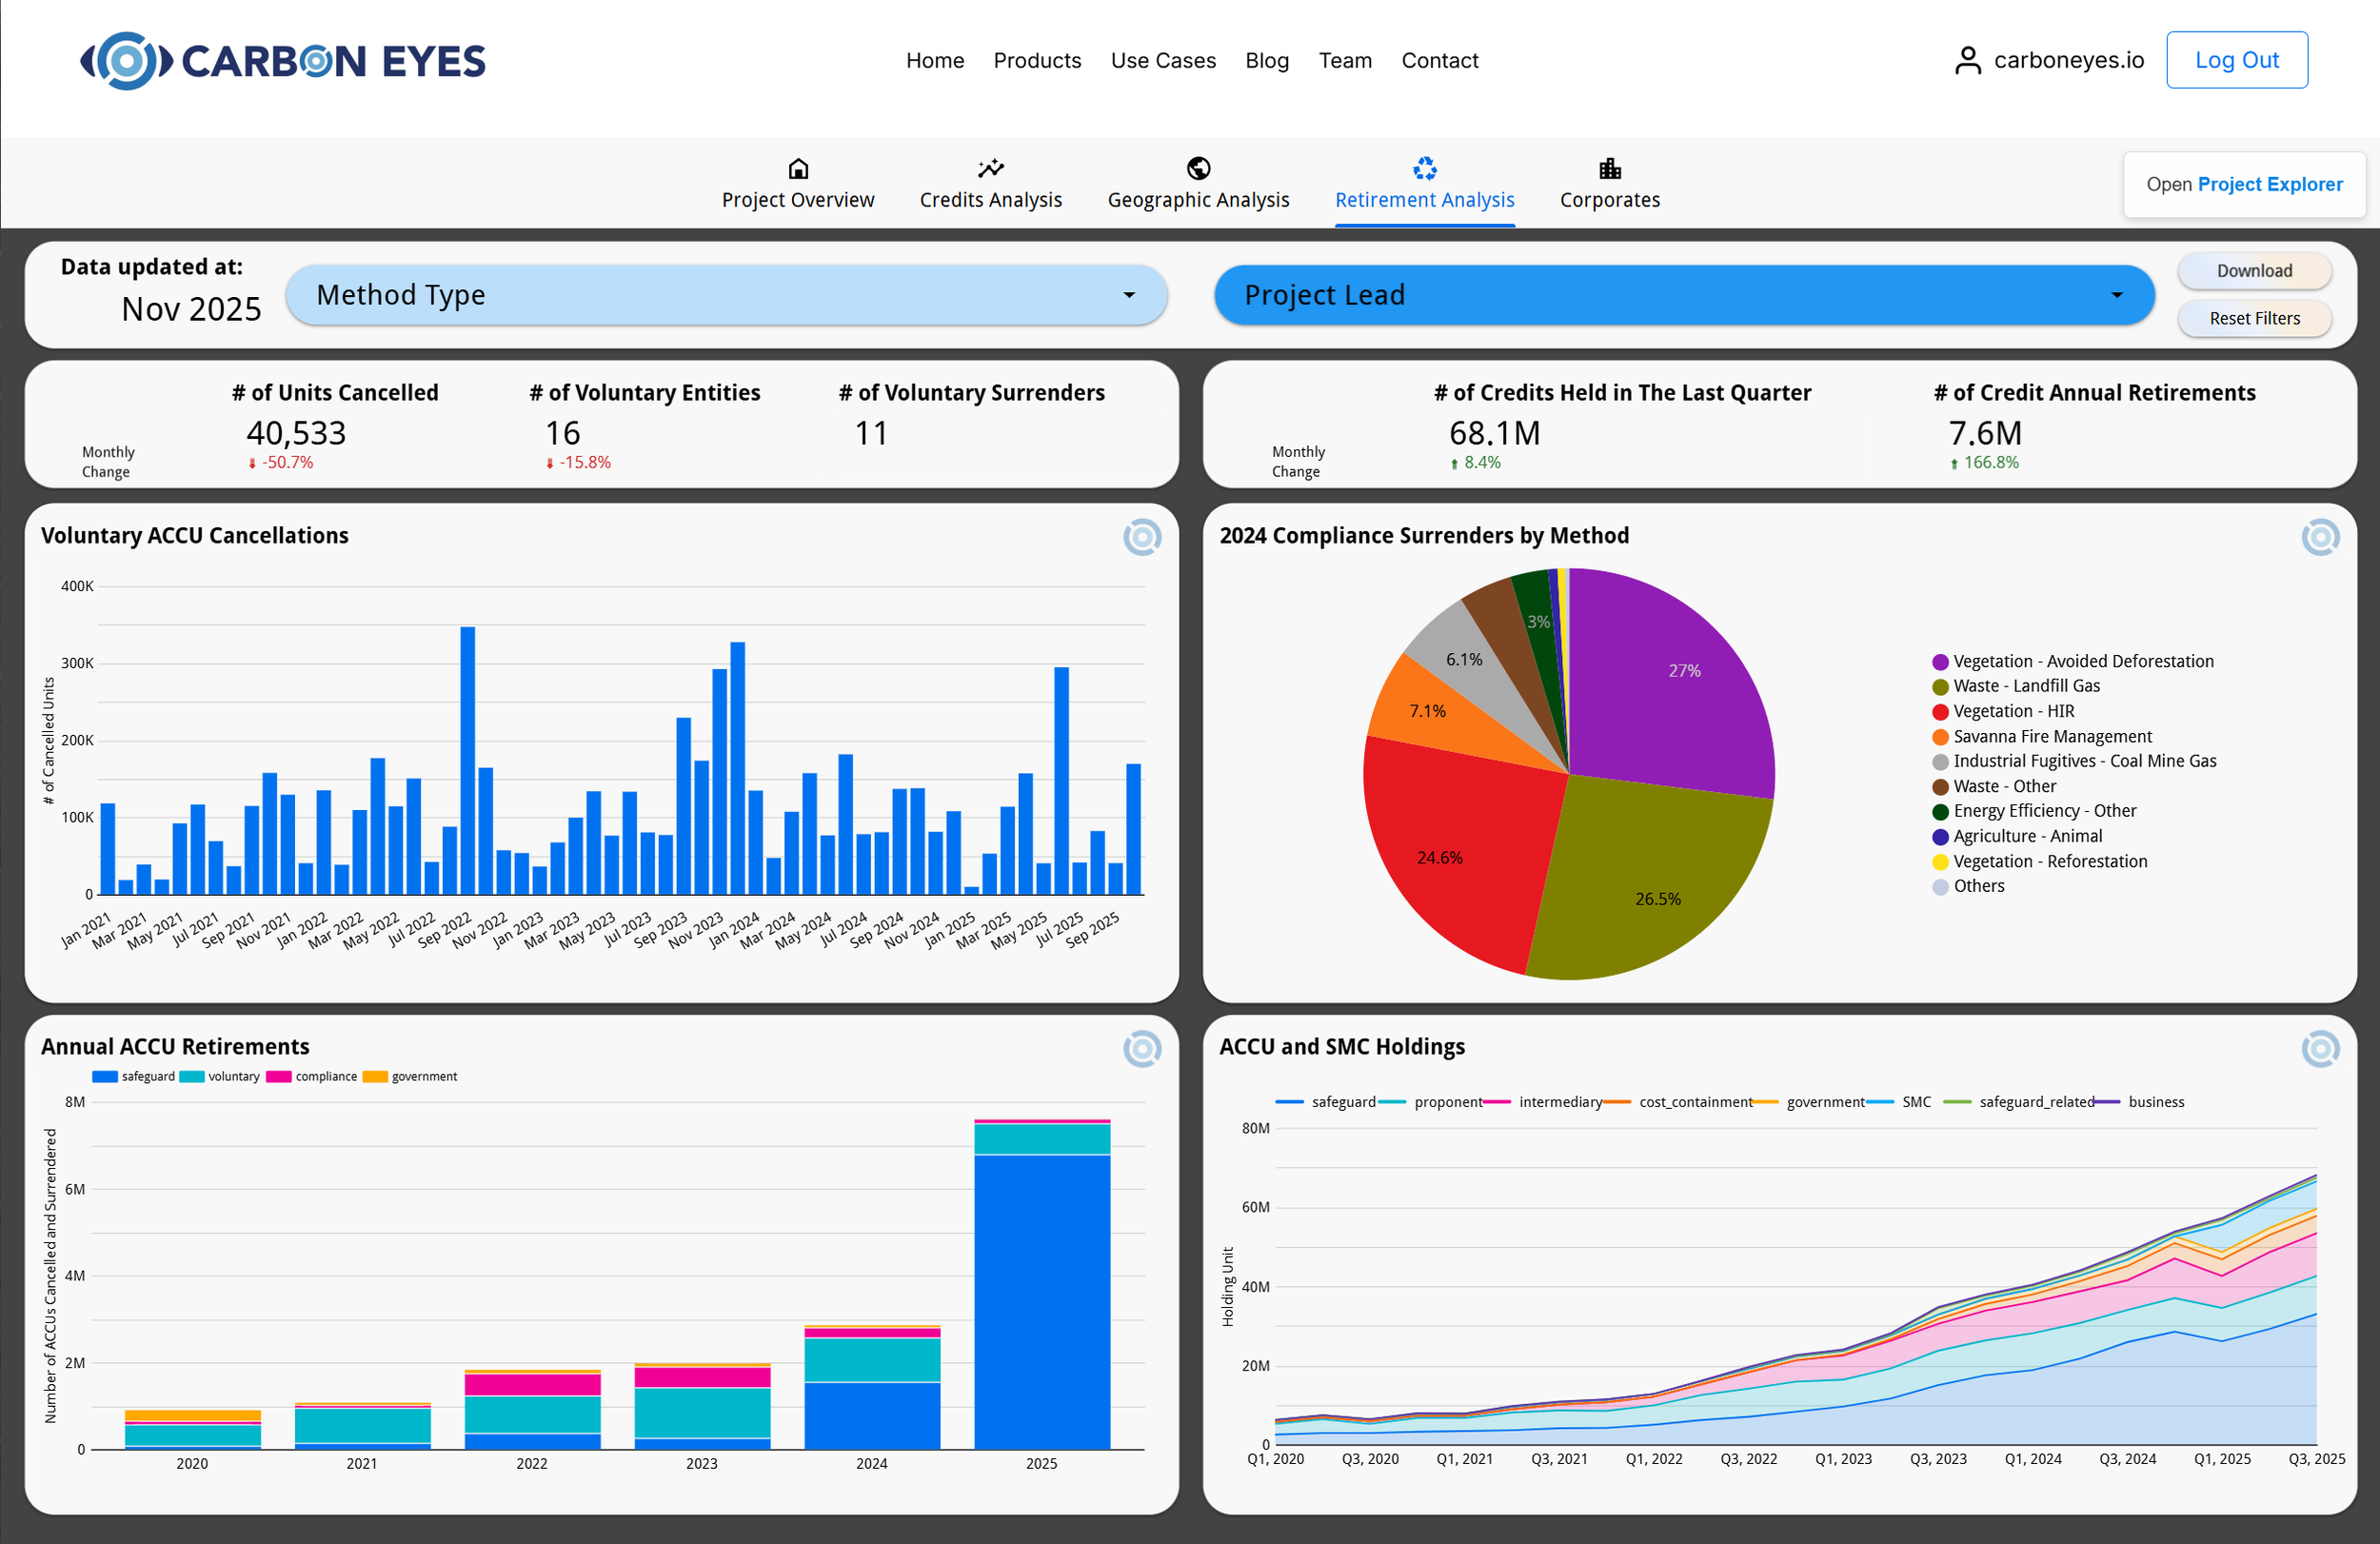
The methods that matter
Not all methods are equal. Some are quiet achievers in the market, like environmental planting (EP) and soil carbon projects. The project overview lets you break down intitiatives by method, so you can see which approaches are being adopted and which are losing steam. Filtering by method across all charts creates a clear story. For example, pick EP and soil carbon, and you can instantly compare their growth patterns, revocation rates and credit outcomes.
For example, the number of environmental planting projects has expanded enormously, rising from only two registrations in 2012 to 86 last year.
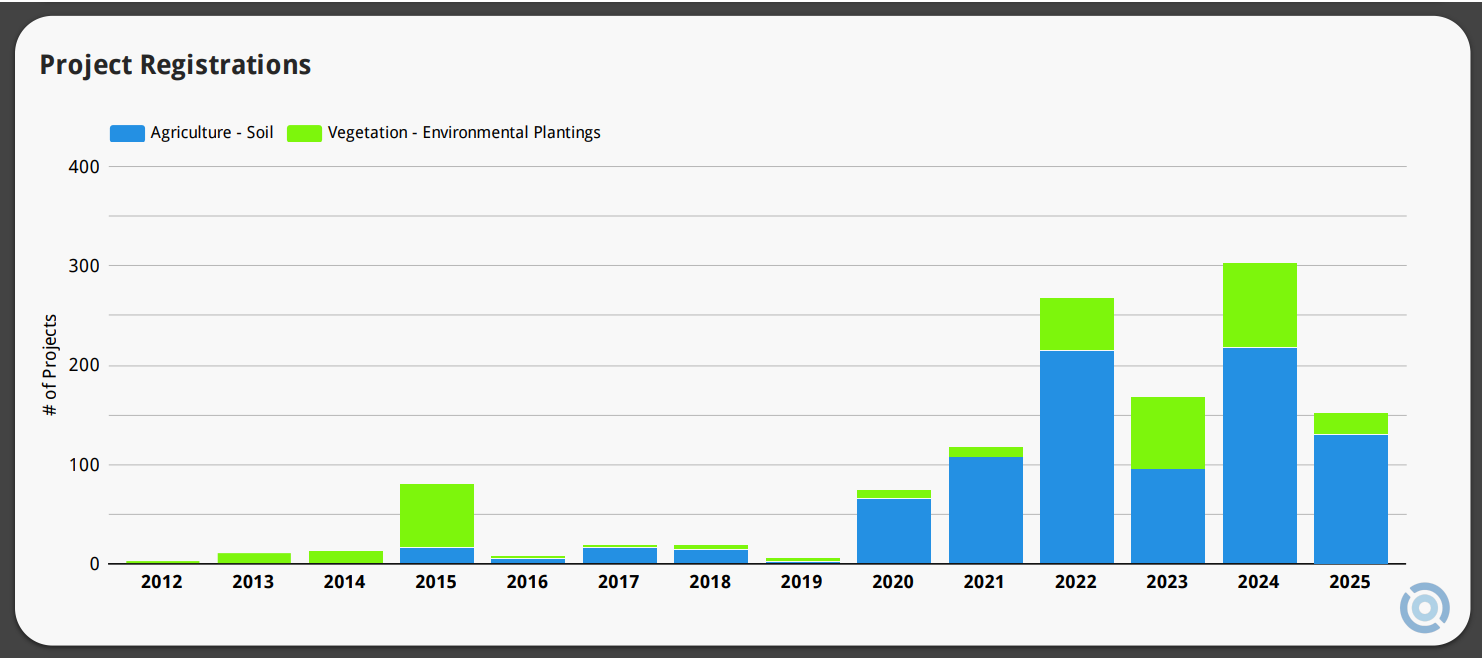
New Project Registrations: EP and Soil
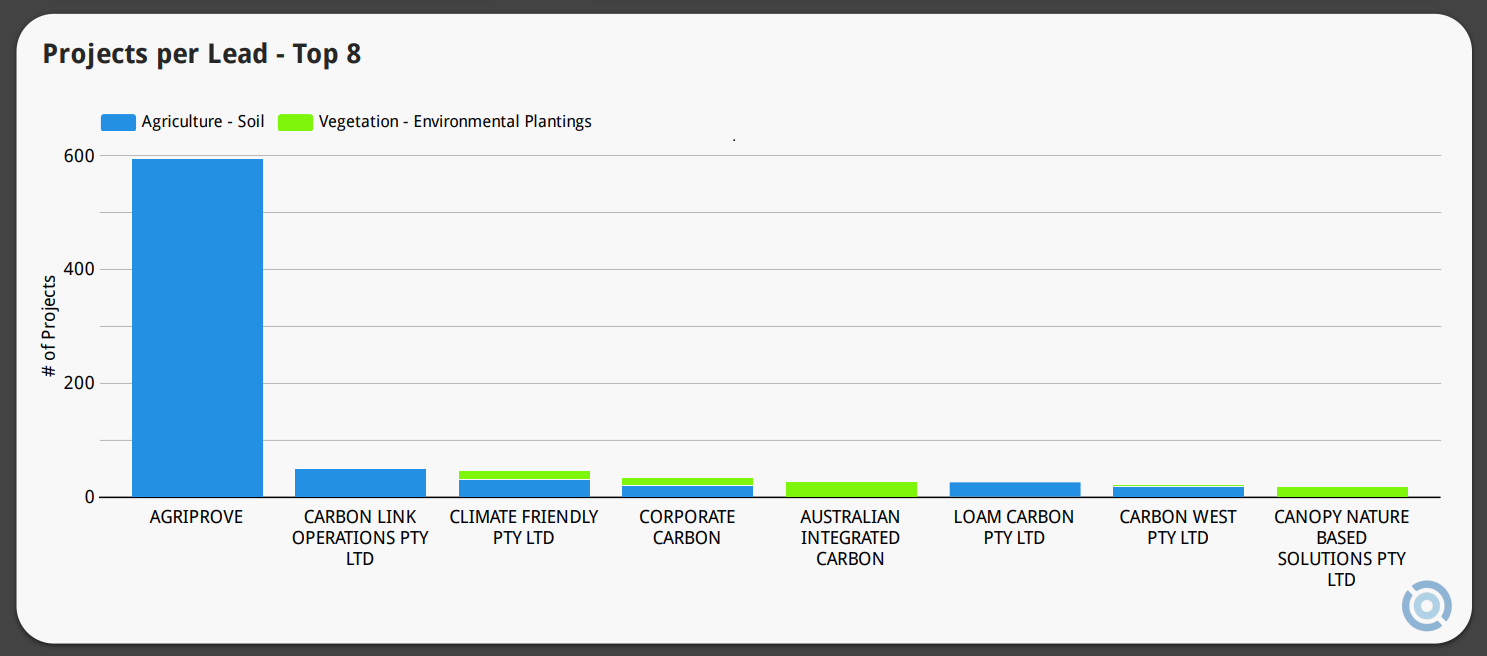
Who is driving the market
Every project needs a lead, often referred to as the proponent. Some are specialists running numerous projects across different regions, whilst others are small players with just one or two. The overview highlights the top eight leads by number of projects and breaks them down by method. This shows not only who is active, but where their focus lies. This helps identify concentration in the market. Is activity spread across many carbon companies or are a few large proponents carrying most of the load?
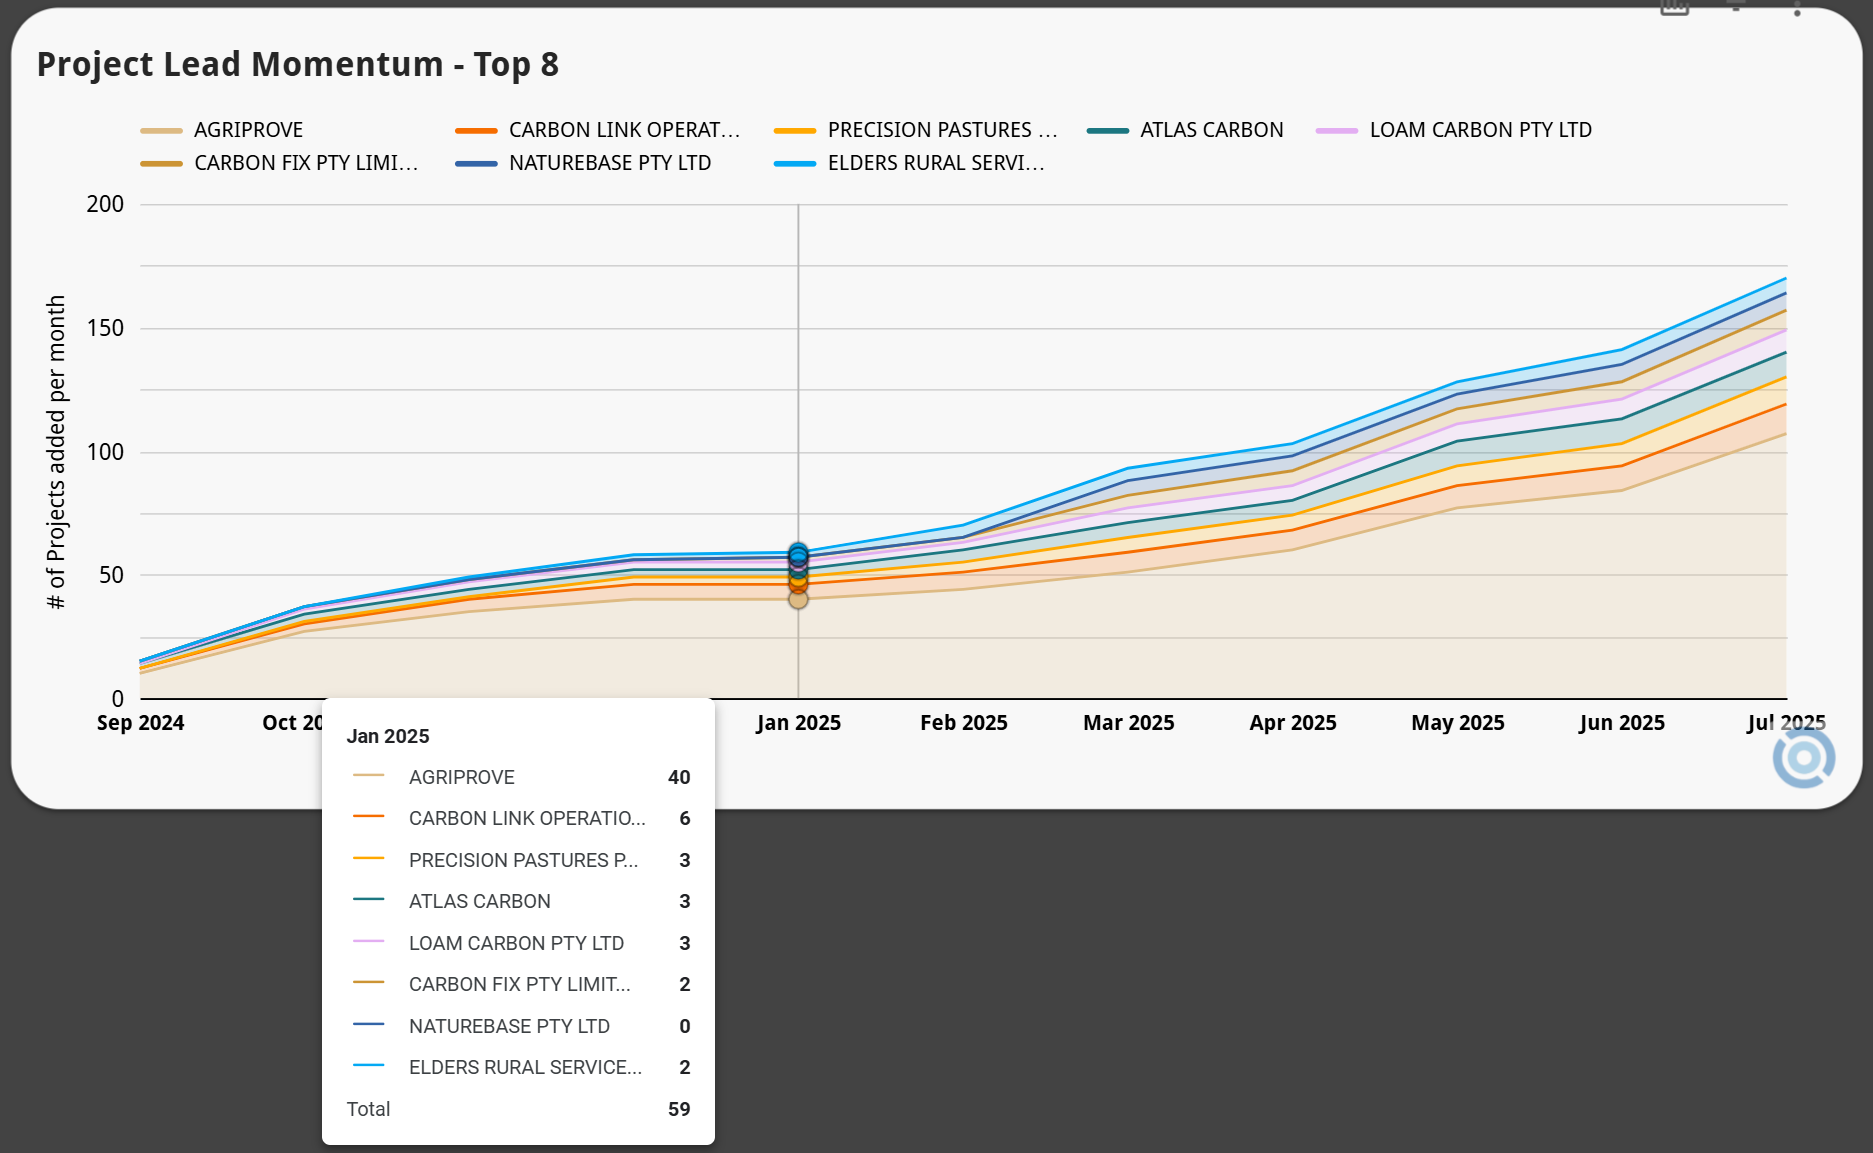
Momentum in motion
Carbon markets are rarely static. The pace of new registrations tells you a lot about confidence and direction. By looking at registrations over time, you can see when activity surged, when it dipped and whether momentum is building or falling right now. You can also compare that against project revocations to test the strength of that momentum. If registrations are high but revocations are creeping up, the picture is less positive than it first appears.
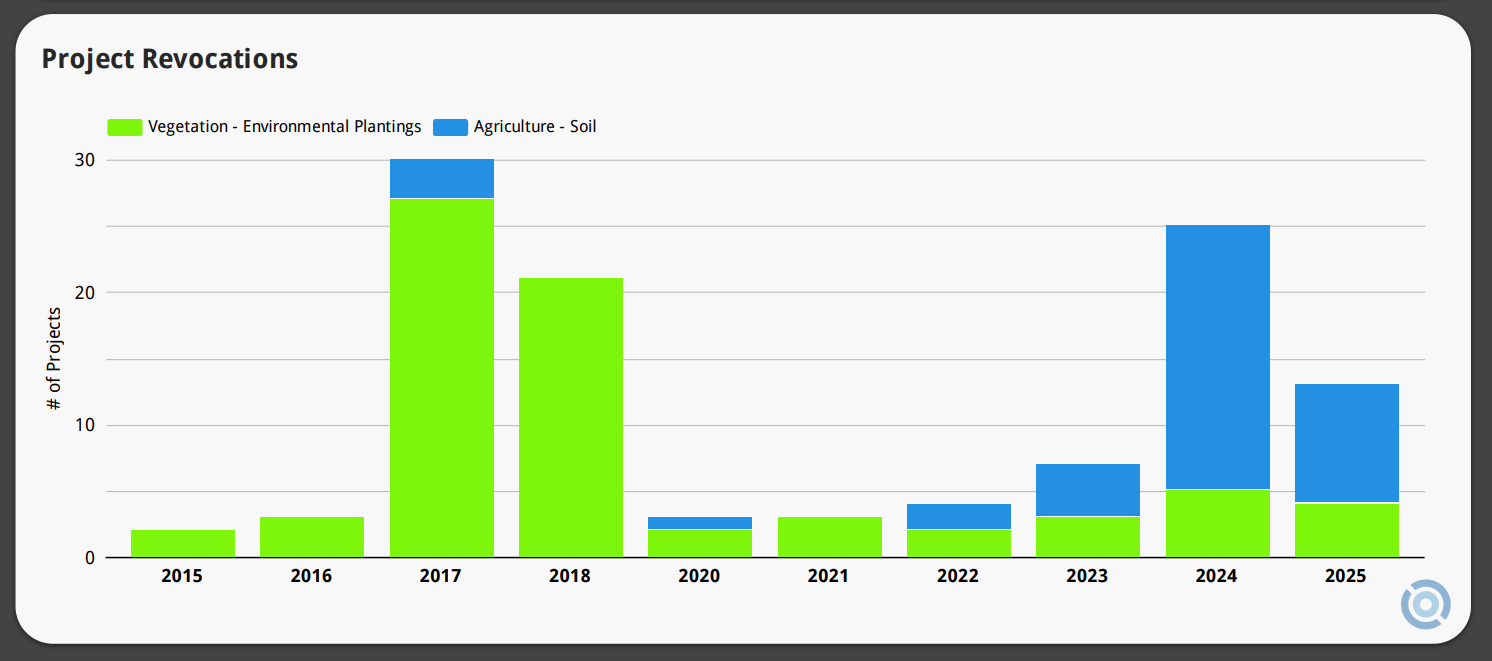
Revocations tell their own story
Revoked projects often get less attention than new ones, but they are an important signal. Revocations can highlight methods that are proving too complex in practice, projects that ran into obstacles on the ground, or changes in policy that makes certain approaches less viable. Seeing these trends over time helps balance the usual focus on growth and adds nuance to market analysis.
Digging deeper into regions
One of the strengths of this kind of aggregated view is the ability to move from national to regional patterns. For example, click on environmental plantings in Western Australia and you can instantly see the total number of projects, their momentum over time and the credits they have generated. This creates a layered perspective: broad national trends on one hand and specific state-based outcomes on the other. It’s a practical way to answer questions such as whether certain regions are carrying more weight than others, as well as if opportunities are being overlooked.

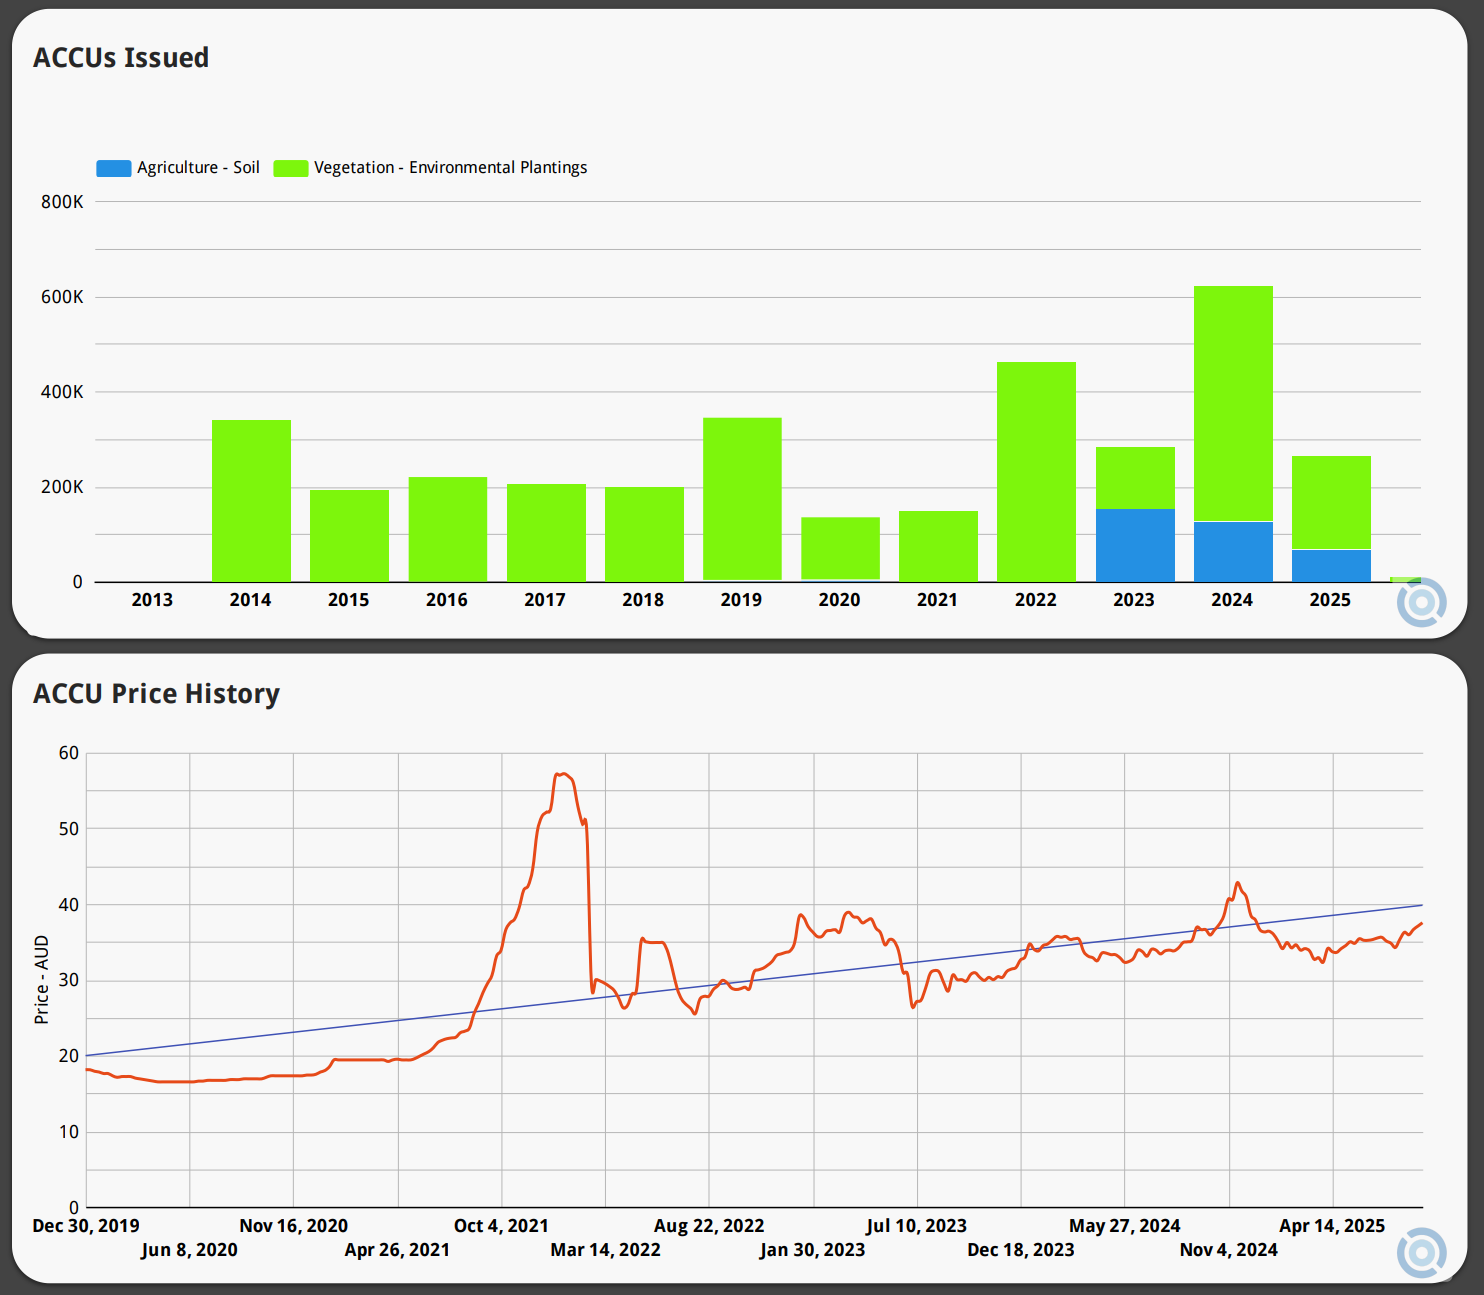
From projects to credits
Ultimately, projects are only the first step. The real measure of success is credits issued. Being able to track not just registrations but the flow of ACCUs allows you to connect activity on paper with actual carbon outcomes. Linking project data with credit analysis shows whether growth in registrations is translating into a meaningful supply of units, or if there is a lag that might affect future availability.
A flexible way to explore
The power of the overview lies in its flexibility. You are not locked into a single view or metric. You can toggle between methods, proponents, credit analysis and geographies. You can isolate a single proponent or project lead and see their role across the market, or you can compare multiple methods side by side. Whether you are a landholder, investor or market analyst, you can shape the insights around the questions you care most about.
Why it matters
Carbon markets are complex by nature, but they do not have to be opaque. Having a clear, aggregated view of projects and credits strips away much of the confusion and allows anyone to see the market in motion. For those making decisions about where to invest, which methods to back, or how to manage risk, that clarity is invaluable. It changes the conversation from anecdote and assumption, to patterns and evidence.
Want to know more?
Taronga Zoo Conservation Society Australia, Sydney Airport and the NSW Government have teamed up to restore a Box-Gum Woodland on a cleared farming aggregation totaling 3050 ha, read about it here: Coming soon: Taronga Zoo and Sydney Airport Carbon Project.
Carbon Eyes | ACCU Market Intelligence
Strategic data and integrity signals for the Australian carbon market.
1. Carbon Data Platform
The Foundation of Market Transparency | Access the Platform
A comprehensive view of the ACCU landscape. Access structured CER data, project status and issuance trends. Use our core mapping and analytics to establish your market baseline.
2. Integrity & Market Intelligence
Independent Ratings & Supply Forecasts | Upgrade Your Intelligence
Mitigate risk with our paid intelligence layer. Accessed directly within the Platform, these add-ons provide independent ACCU project ratings and forward looking supply forecasts to guide procurement and investment.
3. Land & Asset Decisioning
Identify the Best Opportunities for Carbon Projects
Carbon Potential Report | View Carbon Potential Report (by address)
Instant, address-based viability assessments for lenders and investors.
Carbon Land Search | Identify & Assess High-Potential Assets
Our premium search engine for institutional funds. Identify and de-risk high-potential carbon assets before acquisition.